
Click here to download P3 Financial Bulletin
Weekly Market Forecast: 7th – 15th May 2018
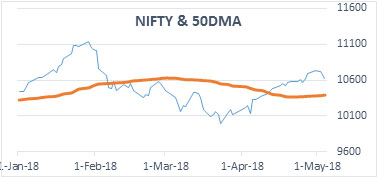
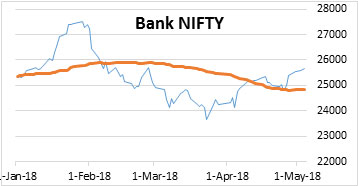
The market turned south this week snapping a five-week bullish move. The NIFTY closed at 10618.25 down 0.69% for the week. Interestingly, BANK NIFTY closed stronger. It closed at 25645.40 for the week, up by 2.10%. The BSE Midcap index closed sharply lower at 16561.01 down 0.98%, and BSE Smallcap also closed in red at 17991.45 down by 1.37%. While, the monthly trend for the broader Indian markets continues to be bullish, the weekly trend is moving sideways. Next week, market movement will continue to be guided by Q4 results. The big ones are ICICI Bank, Godrej Consumer, Eicher Motors, Lupin, Asian Paints, Titan, and Zee Entertainment.
Volatility continued in global markets, the US bourses closed in RED for the third week in a row. Dow Jones closed at 24362.51 down 0.20% for the week but closed sharply up by 332.36 points (1.39%) on Friday. S&P 500 followed DOW, but NASDAQ closed in green for the week at 7209.02 compared to 7119.80, last week.
While Gold closed flat for the week, Silver ended in green. MCX Gold Mini futures closed at 31102 (31119 last week). MCX Silver Mini futures closed at 39780 (39009 last week) up 1.97%.
Indian Rupee (INR) closed flat in the week. USD/INR closed at 66.6450 on Friday.
InterGlobe Aviation (Indigo): The company reported 73% drop in Q4 FY18 profits on Wednesday 02 May 2018. Though its total income increased by 17.8% at INR 6,056.8 crores, it did not cheer the traders. Indigo’s share prices reacted sharply and fell by about 20% on the result day, before closing at 1206.05. The stock was down by 16% in the week. SEBI is investigation a sharp fall of 6% on 27th April, before the announcement of results and information related to the exit of Aditya Ghosh, President.
Events in the week:
- Tuesday 08 May – US data on Job Openings (Mar 18)
- Wednesday 09 May – US Produced Price Index (PPI) MoM for Apr 18.; US Crude oil inventories
- Thursday 10 May – China CPI, PPI data; US Core CPI MoM (Apr18)
- Friday 11 May – India Bank deposit & loan growth, Forex reserves, manufacturing output MoM (Mar 18); US Export/ Import price index MoM (Apr 18)
The result calendar
- Monday: ICICI Bank, Tata Chemicals, Exide Ind
- Tuesday: Godrej Consumer, Jubilant Food, Petronet LNG
- Wednesday: Eicher, Arvind, Lupin,
- Thursday: Asian Paints, Piramal, Titan, ZEE
- Friday: Cadila, Canara Bank, Havells, P&G
Trading Ideas: Based on technical analysis, we recommend the following trades for the week:
HDFC: BUY@ 1888.45; Stop Loss 1874.45; Target 1930.45
USD/INR: Sell@ 66.6400; Stop Loss 67.0100; Target 66.4550
Last week’s Technical Call:
1. SBI: BUY@ 234.45; StopLoss 231.95; Target 239.45…Target achieved
2. HCL Tech: BUY@ 1022.9; StopLoss 1010.20; Target 1060.55…Stop Loss triggered
Credit- Dr Amiya Sahu
Bond market update
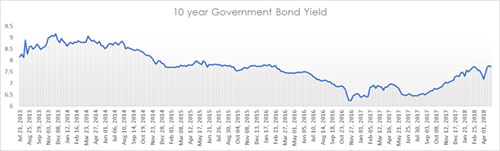
Bond market made a comeback with 10-year govt bond yields falling by 0.5% last week (4 basis points). This slight fall in the yield is due to RBI announcement of buy back of 100 Billion rupees bonds vide open market operation. The buy back comes after three successive failures in selling all the bonds placed for auction, the last auction seeing only 12.5% being sold the balance had to be brought by primary dealers.
Investment Series 3: - Risk profiling and asset allocation
 In our last article we had understood how to plan our goals and mainly to understand the aspects one needs to consider while arriving to the amount that needs to be saved/invested to achieve these goals. The example mentioned had an indication of the monthly amount based on investment in various asset classes. Now a question that comes across to most of you is,
Which are the asset classes available, how to decide on which ones to invest in and in what proportion?
Do we need to invest in all asset classes or invest only in one asset class, how to decide?
These questions can be answered after understanding the concepts of risk profiling and asset allocation. These two concepts are very important while making your investment decision. Let’s understand these two concepts.
Risk Profiling
To understand what is risk profiling? We need to understand what risk in the first place is.
Risk as we all know is a situation which involves an exposure to an event that can harm us. In financial terminology risk can defined as (as per Investopedia) “The chance an investment's actual return will differ from the expected return. Risk includes the possibility of losing some or all of the original investment.” Risk varies from one asset class to another, for ex, A debt investment will have a very low risk as there is minimal chance of returns fluctuation and erosion of original investment where as equity on the other hand has a high risk as there is high chance of fluctuation and erosion of original investment. But there are also some investments where the probability of erosion of original investment is maximum and those are call/put options. Although risk is perceived as negative, but there lies a hidden positive. More the risk an individual can take, more are the returns he/she can expect out of his investments; hence we have heard everyone saying equity provides better returns than debt.
Risk for financial assets is defined by standard deviation (SD, Sigma: σ). Standard deviation signifies the variation of the returns (+/-) from the average return. Once we know this, we need to understand the implication of this. Let me explain with an example, suppose we consider a product with ROI 15% with a SD of 10%. We simply understand that the returns of 15% can be either 5% or 25%, but there is more to it. As per normal distribution, a one sigma (one standard deviation) signifies that probability of outcome is 68% i.e. in our example it implies that 68% of the times the returns will be in the range of 5% to 25%. Two sigma implies a probability of 95% i.e. 95% of the time the returns will be in the range of -5% to 35% and a three sigma a probability of 99.7% and so on. There are also other risks associated with investments, we will discuss on the various types of risk when we discuss the investment objects.
 So, assuming we have understood what risk is, let’s move forward and understand Risk profiling. Risk profiling involves an analysis of an investors risk appetite i.e. risk-taking capacity. This is a pre-requisite for an investor before making any investments, it defines how much an investor can get exposed to a defined asset class. Risk profiling is done through tools using series of questionnaires. These questionnaires are designed in such a way to gauge the risk-taking ability of an investor, these include information on important parameters like income, age, dependents, Single income, liabilities, expenses, stability of income, understanding of products etc., a sample tool can be seen in the image.
The outcome helps the investor to understand in which asset classes he needs to invest. But an important thing to note that there can be a situation where one might have to invest without adhering to his/her risk profile. Such situations can arise if there are important goals to achieve and limited resources to achieve. In Such cases one has two options i.e. either to reduce the goals/forgo the goal or take the risk and move on, the choice lies with the investor alone.
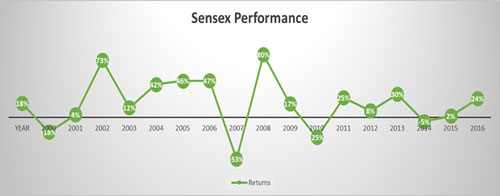
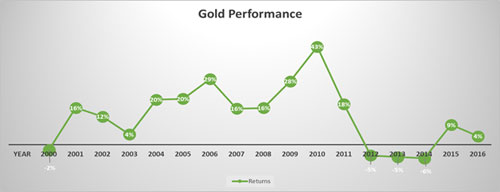
Asset allocation Most of us have encountered this saying, “Never keep all your eggs in one basket”. The entire concept of asset allocation can be explained through this statement, but before that let us understand what are the different asset classes that are available. Three broad classes of assets are (a) Equity (b) Debt and (c) Cash. In addition to this there are other asset classes which are Real estate, commodities like gold, silver etc., Currency. Let’s move back to understand the concept of Asset allocation. Asset allocation involves allocating your investment into different asset classes to achieve your goals. The purpose of asset allocation is to diversify across different assets thus to reduce the total risk to the investor. In the year 2008 the stock market fell by 54% but on the other hand gold in the year 2008 gave a return of 16% similarly there have been many occasions (returns data shown below), so an individual holding both these assets was far better than the one with either asset. This can be also explained by an individual investing 100% in equity and the other in 50% equity and 50% debt. The latter will be better of with respect to the total risk than the earlier.
To understand how to go about in asset allocation, one must understand his risk appetite through risk profiling. This will give a clear picture on the proportions of investments to be held in the asset classes. There are two types of asset allocation strategy (a) Strategic asset allocation and (b) Tactical asset allocation.
Strategic asset allocation is allocating of assets based on the goals. This asset allocation strategy works on allocating assets to get the desired returns of the portfolio in the time horizon outlined to achieve the goals. Strategic asset allocation is a long-term plan which needs to be reviewed periodically so that the returns are inline with the plan outlined.
Tactical asset allocation is the allocation of assets based on the decisions that come out of based on the likely behavior of the market. A individual changing his assets periodically based on the sentiments of the market at large is said to be a tactical asset allocation.